Kubernetes Features
Resource Browser
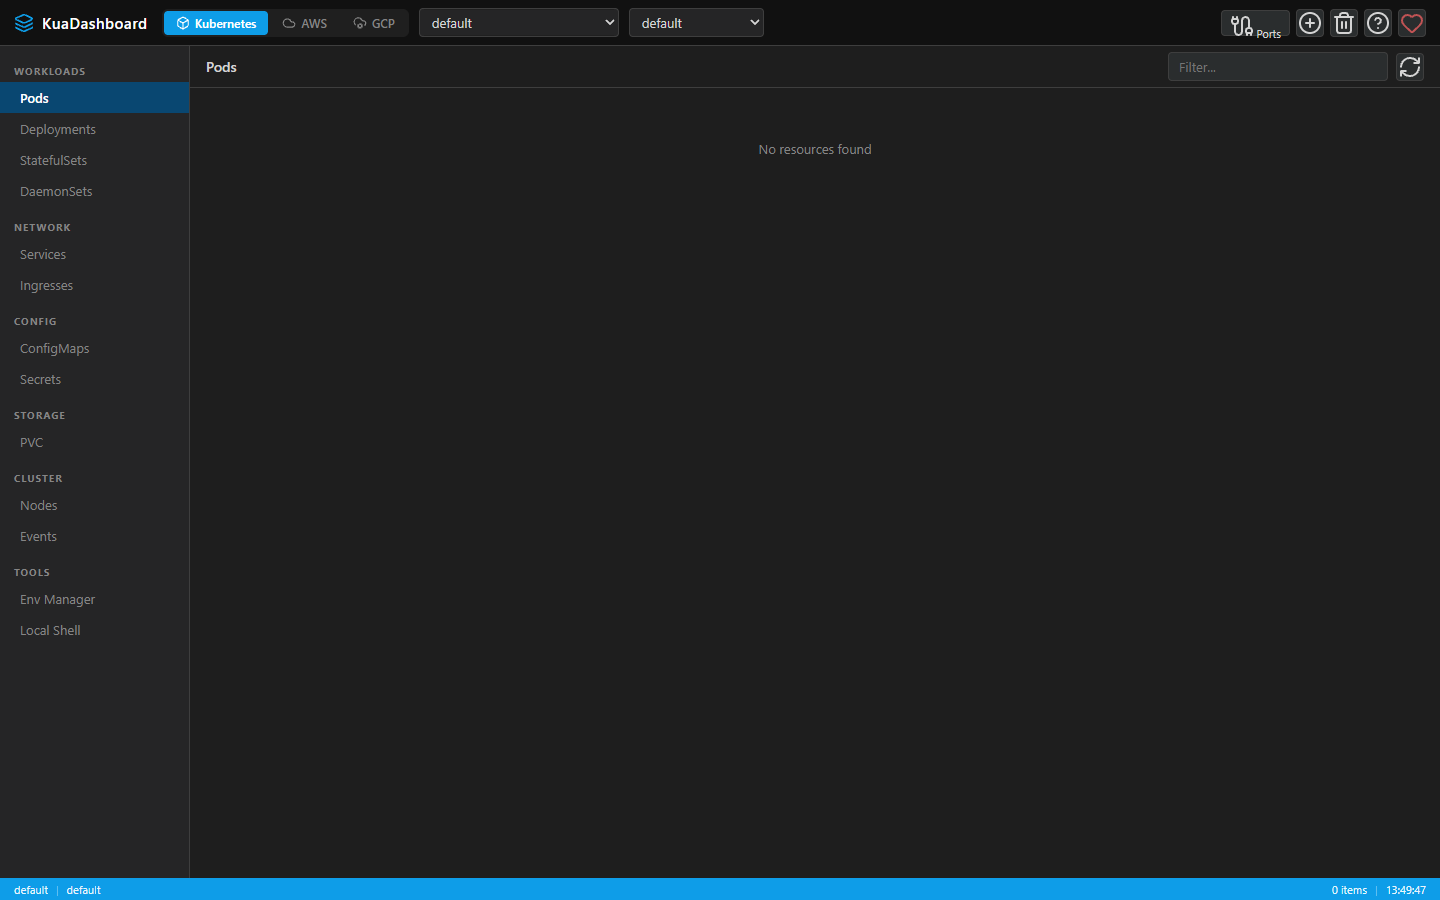
Browse all major Kubernetes resources with sortable, filterable tables:
- Workloads: Pods, Deployments, StatefulSets, DaemonSets, ReplicaSets, Jobs, CronJobs
- Network: Services, Ingresses, IngressClasses, Endpoints, EndpointSlices, NetworkPolicies
- Config: ConfigMaps, Secrets (values redacted by default)
- Storage: PersistentVolumeClaims, PersistentVolumes, StorageClasses
- Policy & Scheduling: ResourceQuotas, LimitRanges, HPAs, PDBs, Leases, PriorityClasses, RuntimeClasses
- Admission & Cluster: MutatingWebhookConfigurations, ValidatingWebhookConfigurations, Namespaces, Nodes, Events
Each resource table shows key fields (name, namespace, status, age) and provides contextual actions. Tables support multi-select for bulk deletion where Kubernetes allows deletion of the selected resource type.
The Age column is displayed as a readable duration and still sorts by the real elapsed time, so values such as 30sec, 2min, 23hrs 10min and 1day 3hrs 10min order correctly in both directions.
Selecting a row opens a resizable detail panel with a resource-specific summary, labels, containers, networking, storage, events or scheduling fields depending on the resource type.
Auto Refresh
KuaDashboard can refresh the active Kubernetes view automatically without changing your selected namespace, resource type or detail panel.
Auto-refresh is also respected across AWS, GCP and Helm views, so the currently visible operational surface stays current without manual reloads.
Live Log Streaming
Stream pod and workload logs in real time via WebSocket:
- Select specific containers in multi-container pods
- Stream Pods directly or resolve Deployments, StatefulSets and DaemonSets to their active Pods
- Multi-tab interface — stream logs from multiple pods or workloads simultaneously
- Search within log output and filter by serialized date/time
- Download the current filtered log view as a
.logfile - ANSI/VT cleanup and chunk buffering for correctly serialized framework logs
- Auto-scroll with manual override
Interactive Shell (Exec)
Open a terminal session directly into any running pod:
- Full PTY support via WebSocket
- Container selection for multi-container pods
- Keyboard shortcuts work as expected
YAML Viewer & Editor
View and edit the full YAML manifest of any resource:
- Confirmed search action with next/previous navigation
- Lint/validation before save, with line and column diagnostics
- Save button and keyboard shortcut support
- Current line, column, total line count and section path indicator
- Autocomplete suggestions via
Ctrl+Space - Edit in-place and save changes back to the cluster
- Secret values are
[REDACTED]for security
Config, Secrets & Environment Editing
ConfigMaps and Secrets include a focused key/value editor so common edits do not require hand-editing the full manifest. Secret values remain protected in YAML views while still supporting controlled edits from the data tab.
Workload detail panels expose container environment variables, making it easier to inspect and update env definitions without leaving the resource context.
Resource Detail Panel
Click any Kubernetes resource row to open a right-side detail panel:
- Overview — resource-specific fields for Pods, workloads, Services, Ingresses, Secrets, PVCs, Nodes and Events
- YAML — structured tree view of the live manifest
- Metrics — CPU and memory cards for Pods using
metrics.k8s.io - Metrics — CPU and memory cards for Pods, workloads and Nodes using
metrics.k8s.iowhere available - Prometheus fallback — discovers Prometheus services and queries them through the Kubernetes API server proxy when Metrics Server is unavailable
- Events — related event and notification view for scheduling, image pull, health and lifecycle diagnostics
- Resizable layout — drag the divider to adjust the panel width
Helm & Metrics Server
The Helm view can search configured chart repositories, install charts into the active cluster and list installed releases. Install operations show output and release status so long-running installs are visible.
When installing metrics-server, KuaDashboard offers a compatibility preset for local or self-signed clusters:
args:
	- --kubelet-insecure-tls
	- --kubelet-preferred-address-types=InternalIP,ExternalIP,Hostname
apiService:
	insecureSkipTLSVerify: true
Scaling
Scale Deployments and StatefulSets with a simple dialog:
- Shows current replica count
- Input desired replicas
- Immediate apply with status feedback
Node Management
Advanced node operations:
- Cordon — Mark node as unschedulable
- Uncordon — Restore scheduling
- Drain — Safely evict all pods (cordon + evict)
Context & Namespace Switching
- Multi-context — Switch between Kubernetes contexts from the header dropdown
- Multi-namespace — Filter by namespace or view "All namespaces"
- Import kubeconfig — Add new clusters directly from pasted YAML, a desktop file picker or a registered kubeconfig path
- Delete context — Remove unwanted contexts